Analytics
The Analytics page of your Member Dashboard will help you see how your patients are responding to appointment reminders. The graphs on this page represent:
- % Appts confirmed by channel - These are your appointment confirmations, broken down by percentage of patients who confirmed by either Email, Voice, Text, or through their Patient Pages.
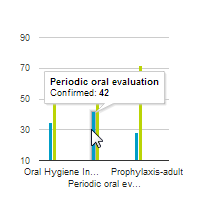
- Confirmation rate for top three procedures - The number of patients who were scheduled for each of your top three procedure codes, along with the number of those patients who confirmed their appointment.
- No-show confirmation status - The percentage of your no-shows that had been previously confirmed by your patient.
- % No-shows by procedure - The procedure code associated with your no-show appointments
You can hover your mouse over your graphs to see specific information about each field represented.
Members of our support team are available Monday through Friday, from 6:00 AM until 5:00 PM Pacific. You can reach us Toll Free at 888-416-8431.