First Call
At the top of your monthly Search Report, you will find information about, and statistics from, your First Call service.
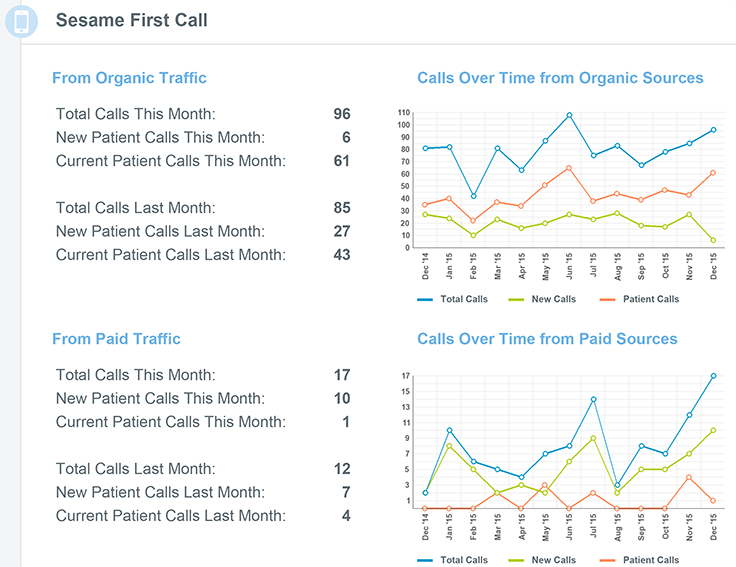
From Organic Traffic
These calls originate from Organic Traffic, which is traffic that comes from search engines. The top of this section is devoted to detailing your total calls from search engine traffic for this month, then breaking down those calls into number of callers who identified themselves as New patients, versus the number of callers who identified themselves as Current or existing patients. The bottom portion is the same information from the previous month.
Calls Over Time From Organic Sources
This chart represents calls generated by search results over the previous 12 months. The blue line represents the number of total calls you received from Organic sources. The yellow-green line represents how many of those callers identified themselves as being new callers, and the orange line represents how many identified themselves as being current patients.
From Paid Traffic
These calls originate from paid advertising campaigns. Since different tracking numbers are assigned to these calls, they are separate from calls that come from search engine results. As with the chart for calls from Organic Traffic, the top of this section is devoted to total calls for the month, which are then broken down into number of callers who identified themselves as New patients, versus the number of callers who identified themselves as Current or existing patients.
Calls Over Time From Paid Sources
This chart represents calls generated by paid advertising campaigns over the previous 12 months. The blue line represents the number of total calls you received from Organic sources. The yellow-green line represents how many of those callers identified themselves as being new callers, and the orange line represents how many identified themselves as being current patients.
SEO
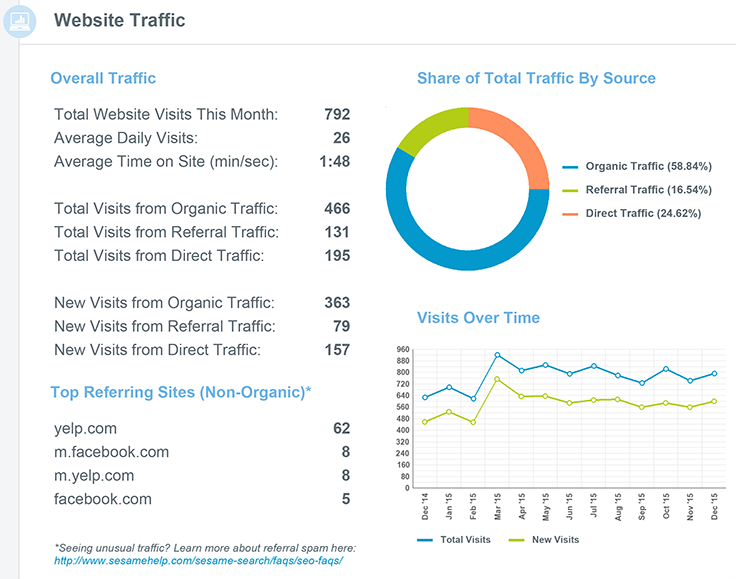
Overall Traffic
In your monthly Search Report, you will find a section that details your website traffic for that reporting period. Starting at the top of your Website Traffic, on the left, you will see a detailed breakdown of your Overall Traffic for the month. In addition to your total visits for the month, you can also view the average time each user spent on your site. New visits and Total visits are further broken down to identify the type of traffic.
Organic Traffic is traffic that comes from a search engine or other search result.
Referral Traffic is traffic that comes from another website, such as your HealthGrades profile or Facebook page.
Direct Traffic is traffic that has no source information, or traffic from a user who visited your website directly by typing in your website address.
Share of Total Traffic By Source
To the right of your Overall Traffic is a pie chart that shows you a pictorial representation of your total traffic by source: Organic, Referral, or Direct.
Top Referring Sites (Non-Organic)
This is a list of the top sites that generated Referral Traffic for your website.
Visits Over Time
This graph is a visual representation of the number of Total visitors and New visitors your website has received each month for the last 12 months.
This information may be incomplete for the date range displayed, if you have only recently activated Sesame SEO.
Below your Website Traffic is the section specific to your Sesame SEO service. This section will provide you with information on the success of our efforts as it translates to traffic driven to your website. Since SEO is act of optimizing your site for search engines, this section focuses on Organic, or search engine, traffic.
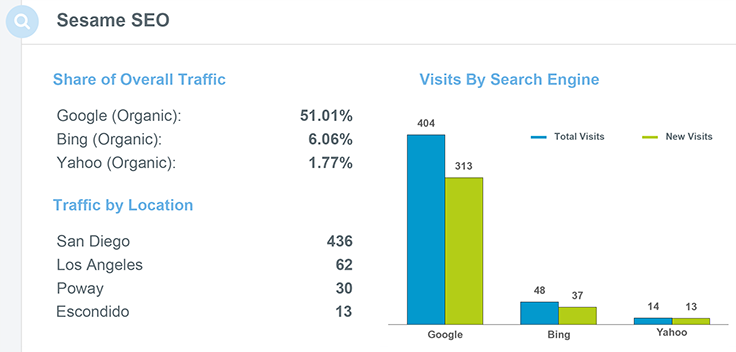
Share of Overall Traffic
This section is a detailed account of the sites that provide Organic Traffic for your website; i.e., the search engines people are using to find you. The information here is a percentage of your total website traffic (which includes Direct and Referral traffic), not just Organic Traffic. This helps you to identify just how much monthly traffic is generated from various search engines, and helps to track how effective your ranking is in generating this traffic.
Visits By Search Engine
Another way to view the results of your SEO efforts is to translate Organic Traffic into the number of hits your website has received in a month from each search engine. These hits are divided into Total Visits and New Visits.
Traffic By Location
Not only can you see how many hits your website has received, how you received them, and whether they were from new visitors, you can also learn the geographical location of these hits. This will help you to focus your SEO efforts on the regions that matter the most to your practice, and ensure that those efforts are providing the results you desire.
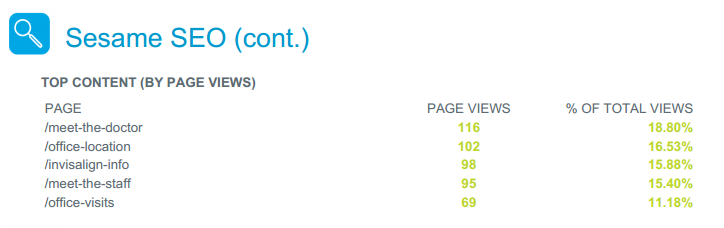
Top Content (by Page Views)
This section lists which pages of your website are receiving the most traffic, which allows you to tailor those pages to provide the best information for new visitors and prospective patients. You can also use this information to make sure the pages you want to be found — the pages that are most important to your practice — are the pages that receive the most traffic.
Social
Your monthly Search Report will include information gathered using information and insights from Facebook to show your activity during that reporting period.
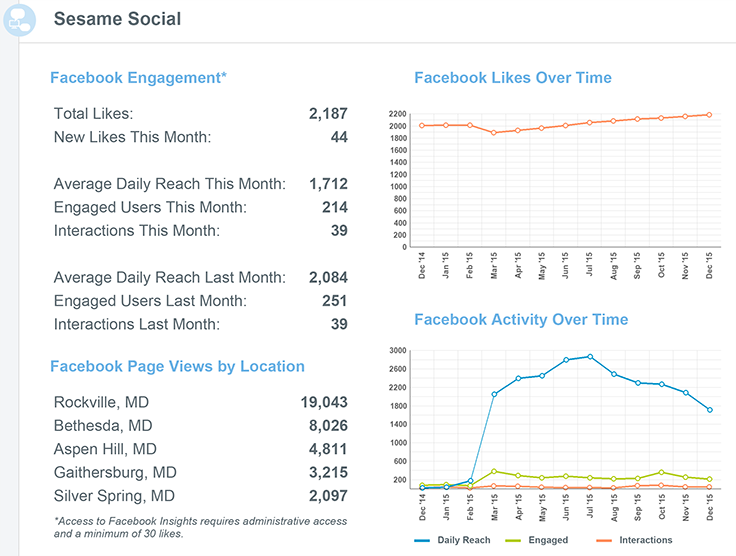
Facebook Engagement
Depending on the practice, the number of likes will vary, but growth and an increase of Facebook likes each month is everyone’s goal. In addition to likes, Facebook takes a look at how how well your content is doing with Reach, Interactions, and Engagement numbers.
Impressions are the number of times a post received a like, share, or comment.
Reach is the number of unique people who received impressions of a Page post.
Engagement rate is the number of people who saw a post and liked, shared, clicked, or commented on it.
Total Facebook Likes Over Time
This graph charts your total Facebook Likes over a period of 12 months.
Facebook Page Views by Location
Facebook Page Views by Location establishes the geographical radius of your Facebook engagement. Generally, views should come from the area around your location, meaning that you target patients and prospective patients in your region, but occasionally when a patient shares a post, it could go to friends and family that aren’t in the area.
Facebook Activity Over Time
This is your Daily Reach, Engagement, and PTAT activity over a 12-month period.
The blog posts are posted weekly and cover educational topics that are tailored to the services you offer. This is great for SEO purposes, because search engines will see we are updating the website once a week and will improve your ranking. In addition, the blog is a great way to connect with your client base by offering information and personally reaching out to them. Personal blogs about a new staff member, a new service, or upcoming office event resonate with patients on a personal level.
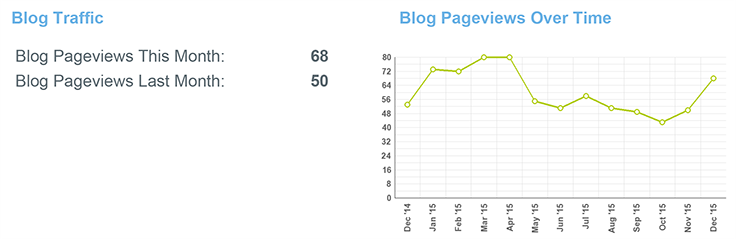
Blog Traffic
This is a simple list of the number of views your blog received in the reporting month, and the month prior.
Blog Views Over Time
This is a graph that charts your total blog page views over a period of 12 months.
YouTube is the second-most-used search engine, behind Google, and is owned by Google. By consistently posting videos to YouTube, we improve your YouTube presence, but also your Google presence. Video streaming is extremely popular with the younger demographics and is a great place to locate and find information.
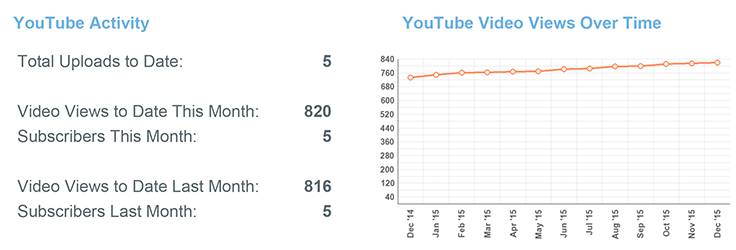
YouTube Activity
Total Uploads to Date will show you how many videos have been uploaded to your channel, followed by the number of Video Views and Subscribers for the reporting month and the month prior. Video Views simply refer to when someone watches your video, whereas a Subscriber is someone who has opted to subscribe to your channel and receive email updates when new videos are posted.
It’s important to understand that the number of Subscribers your channel has is not a direct indication of success or failure. It is not necessary to have a large number of Subscribers for your channel to be an effective marketing tool for your practice.
YouTube Video Views Over Time
This graph charts your total number of Video Views over a 12-month period.
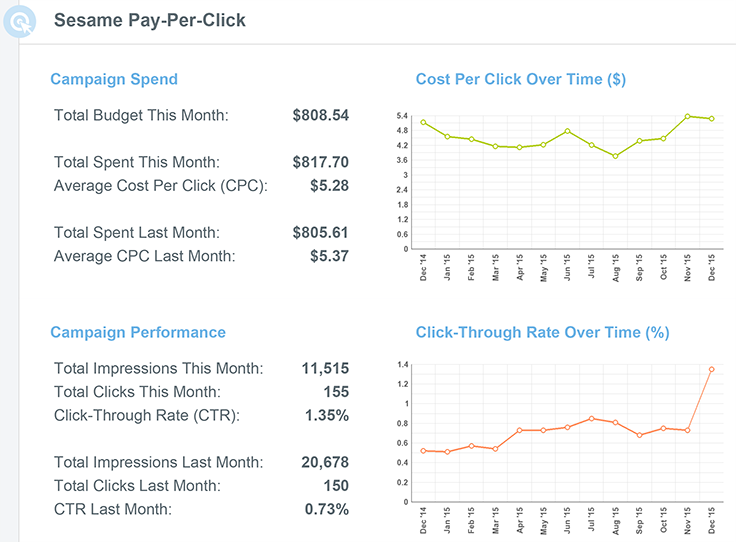
Search Engine Marketing (Pay-Per-Click)
Your monthly Search Report will include Pay-Per-Click reporting for the previous month. This report is broken down into two graphs, with the top graph representing your average Cost Per Click (your total budget for the month, divided by the total clicks for the month) for the campaign; and the bottom report representing your Click-Through Rate (the percentage of people who clicked on your ad when it was displayed). Next to each graph is more detailed information about your campaign budget and performance for the reporting period.
 Looking for more information? Check out these Related Pages!
Our Search Team is available Monday through Friday, from 8:00 AM until 4:00 PM Pacific. You can reach the Social team at 866.856.2050 ext. 1 and the SEO team at 866.856.2050 ext. 2 or send us an email at getfound@sesamecommunications.com.